Energy Audit Methodology
Most compressed air energy audits reveal that 20–50% of compressor energy is wasted — in leaks, unnecessary pressure, unloaded running, and heat that could be recovered. For an oil-free compressor system, a structured energy audit is the fastest route to quantifying savings opportunities, prioritising investments, and building the business case for system improvements. This guide walks through a complete audit methodology that any facility engineer can execute.
✦ Step-by-Step Audit Process
✦ Measurement Methods & Tools
✦ Savings Calculation Templates
Why Compressed Air Energy Audits Are High-Value
Compressed air is one of the most expensive utilities in industrial manufacturing — the true all-in cost of producing compressed air, including capital, maintenance, and energy, is typically 3–5 times higher than the raw electricity cost alone, because compressors convert electricity to useful work at only 10–20% thermal efficiency. A kilowatt-hour of electricity used to drive a compressor motor produces only 0.1–0.2 kWh of useful pneumatic energy in the tool or actuator; the rest is waste heat.
Despite this cost, compressed air systems are rarely subject to the same systematic energy management attention as heating systems or production machinery. The compressor runs continuously, maintenance is reactive rather than proactive, and the actual energy consumption is rarely submetered separately from general facility electricity. This information gap is where the energy audit creates value: it replaces assumptions with measurements and identifies specific, quantifiable improvement actions.
For oil-free compressor systems specifically, energy audits carry an additional benefit. Because oil-free compressors typically carry a higher capital cost than oil-injected alternatives, demonstrating that the system is being operated at its peak efficiency strengthens the business case for the oil-free investment and provides documentation for ESG reporting and energy efficiency incentive claims.
What a Compressed Air Energy Audit Covers
A comprehensive compressed air energy audit has five distinct components. Each can be conducted independently, but the most value comes from doing all five together to build a complete system picture:
① Supply-Side Assessment
Evaluation of compressor energy consumption, specific power (kW/CFM), part-load performance, VSD operation, and comparison to nameplate and design specifications. Identifies whether the compressor is performing to its rated efficiency.
② Demand-Side Assessment
Measurement of actual compressed air flow demand at the system and at key use points. Identifies demand peaks, baseload, and production-correlated demand patterns. Reveals whether the compressor is correctly sized for actual demand.
③ Leak Detection Survey
Systematic identification and quantification of compressed air leaks throughout the distribution system. Typically the highest-value component of a compressed air audit — leaks commonly account for 20–30% of total air production in older systems.
④ Pressure Profile Assessment
Measurement of system pressure at multiple points — compressor outlet, receiver, key distribution mains, and end-use points — to identify excessive pressure drop, identify the true minimum required system pressure, and quantify savings from pressure reduction.
⑤ Heat Recovery Assessment
Quantification of the thermal energy available in the compressor cooling circuit and assessment of potential recovery applications in the facility — space heating, process water, low-temperature drying, or other thermal loads currently supplied by fossil fuels.
⑥ Inappropriate Use Identification
Review of compressed air use points to identify applications where compressed air is used inappropriately — cabinet cooling, open blowing for cleaning, sparging — where lower-cost alternatives (fans, blowers, directed nozzles) could replace high-pressure air at a fraction of the energy cost.
Step-by-Step Audit Process: What to Measure and How
1
Establish Energy Baseline (Days 1–5)
Install energy submetering on the compressor motor circuit if not already present. A portable power logger (e.g. Fluke 1760 or equivalent) clamped onto the compressor supply cables provides kW, kVA, and power factor readings every 15 minutes for the logging period. Log for a minimum of 5 working days covering a representative production schedule.
Key metrics to record: Peak kW demand · Average kW demand · Hours at full load · Hours in unloaded/idle mode · Total kWh consumed per day · Compressor discharge pressure setpoint
2
Calculate Specific Power (Day 3–5 analysis)
Specific power (kW per 100 CFM of actual output) is the primary efficiency metric for a compressor. Calculate it by dividing average kW at a known load point by the compressor flow output at that load point (from the manufacturer’s performance curve at measured discharge pressure).
Formula: Specific Power = Compressor kW ÷ (Flow in CFM ÷ 100)
Benchmark: Modern oil-free VSD screw: 15–18 kW/100CFM. If your reading exceeds benchmark by >15%, the compressor element or VSD drive may need servicing.
3
Conduct Leak Detection Survey (Day 4–7)
Use an ultrasonic leak detector (e.g. SDT270, UE Systems UltraProbe, or equivalent) to survey the full distribution system during a production shift. Ultrasonic detectors identify the high-frequency sound of air escaping from leaks that are inaudible to the human ear and impossible to find by feel alone. Survey every pipe joint, valve, regulator, filter housing, and point-of-use fitting.
Leak severity classification (at 7 bar system pressure):
Small leak (<1 CFM): 0.5–1 mm orifice · ~0.6 kW equivalent · AUD $200–350/year
Medium leak (1–5 CFM): 1–3 mm orifice · 0.6–3.0 kW equivalent · AUD $200–1,000/year
Large leak (>5 CFM): >3 mm orifice · >3.0 kW equivalent · >AUD $1,000/year
Quantify total leak rate using the “pressure decay method”: isolate the system from the compressor (no production running), record system pressure, wait 10 minutes, record pressure again. Calculate leak flow from the pressure drop, system volume, and elapsed time. This gives the total leakage as a percentage of system capacity.
4
Map the System Pressure Profile (Day 5–7)
Install calibrated pressure gauges (or use a digital pressure logger) at 6–8 points throughout the distribution system: compressor outlet, after the dryer, at the main receiver, at the start and end of each major distribution main, and at the most pressure-critical use point. Record simultaneous pressures during a peak production period and during low-demand periods.
Benchmarks for pressure drop:
Compressor to dryer outlet: ≤0.1 bar · Pre-filter: ≤0.1 bar · Dryer: ≤0.2 bar
Coalescing filter: ≤0.1 bar · Distribution main: ≤0.3 bar · Total system: ≤0.5 bar
Energy saving: Each 1 bar reduction in system setpoint = ~7% energy saving
5
Assess Heat Recovery Potential (Day 6–8)
Measure the temperature and flow rate of the compressor cooling air or cooling water circuit. For air-cooled compressors, measure the ventilation air exit temperature and estimate ventilation air flow from the fan specification or by air velocity measurement. For water-cooled compressors, measure inlet and outlet coolant temperature and flow rate.
Heat recovery formula (air-cooled):
Available heat (kW) = Compressor input kW × 0.75–0.85 (typical recovery fraction)
Example: 55 kW compressor × 0.80 = 44 kW recoverable heat continuously
At 4,000 hr/year: 176,000 kWh = ~AUD $17,600/year at $0.10/kWh gas equivalent
6
Survey Inappropriate Use Applications (Day 7–9)
Walk the facility with a compressed air flow meter (thermal mass flowmeter or orifice measurement) and identify every application where compressed air is used. Classify each use point as: necessary pneumatic actuation; air knife or blow-off (potentially replaceable with electric blower); cabinet or enclosure cooling (replaceable with filtered fan); open blowing for cleaning (replaceable with directed nozzle at lower pressure).
Key question for each use point: Could this function be performed by a blower, fan, or lower-pressure dedicated source at lower cost than the central compressed air system? If yes, the saving = (CFM at this point ÷ total CFM) × total compressor energy cost.
Savings Calculation Template
Use this template to calculate the annual saving from each identified improvement opportunity. All calculations assume an electricity tariff of AUD $0.18/kWh (adjust to your facility’s actual tariff).
Savings Calculation Summary Table
| Improvement Action |
How to Quantify |
Typical Saving |
| Fix all identified leaks |
Total leak CFM × (kW/CFM) × hours/year × tariff |
15–30% of energy cost |
| Reduce system pressure by 1 bar |
Annual energy cost × 7% |
7% per bar reduced |
| Replace fixed-speed with VSD |
Logged kW difference × hours/year × tariff |
20–35% of energy cost |
| Replace open blow-off with nozzle |
CFM saved × kW/CFM × hours/year × tariff |
AUD $200–2,000/point/yr |
| Implement heat recovery |
Recovered kWh × displaced fuel cost/kWh |
AUD $8,000–25,000/yr |
| Replace filters on differential pressure |
ΔP saving × flow × hours/year × kW/bar × tariff |
AUD $500–3,000/yr |
Audit Report Structure and Presentation
A compressed air energy audit report for internal use or for state energy efficiency programme submissions should cover the following sections. Each section should include measured data, not assumptions:
Section 1: Executive Summary
Total identified savings (AUD/year and kWh/year) · Top 3 priority actions · Summary investment and payback
Section 2: System Description
Compressor model, age, type · Dryer type · Distribution system overview · Operating hours and schedule
Section 3: Energy Baseline
Logged kW data · Specific power calculation · Load factor analysis · Annual energy and cost
Section 4: Leak Survey Results
List of identified leaks with location, severity, and repair priority · Total leak rate · Annual energy and cost of leaks
Section 5: Pressure Profile
Pressure readings at each measurement point · Identified excess pressure losses · Recommended setpoint reduction
Section 6: Improvement Opportunities
Each opportunity with: description · measurement basis · saving calculation · investment estimate · payback period · CO₂e reduction
Tools Required for a Compressed Air Energy Audit
| Tool |
Purpose |
Cost (purchase / hire) |
DIY Feasibility |
| Power data logger (3-phase) |
Energy baseline measurement |
AUD $800–2,500 / AUD $150–300/week hire |
✅ High — clamp-on, no wiring |
| Ultrasonic leak detector |
Leak identification and sizing |
AUD $1,500–8,000 / AUD $200–400/week hire |
✅ High — training available online |
| Digital pressure gauge (calibrated) |
Pressure profile mapping |
AUD $80–250 each |
✅ High — standard tool |
| Thermal mass flowmeter |
Flow measurement at use points |
AUD $3,000–8,000 / AUD $300–600/week hire |
🟡 Medium — insertion type, requires fitting |
| Infrared thermometer / thermal camera |
Heat recovery assessment; hot spot detection |
AUD $200–3,000 / AUD $150–500/week hire |
✅ High — no contact required |
| Dew point indicator (portable) |
Dryer performance verification |
AUD $500–3,000 / AUD $200/week hire |
✅ High — plug into sample port |
For facilities conducting their first audit, hiring equipment rather than purchasing is recommended — the one-time nature of the baseline measurement doesn’t justify ownership of specialised tools. Ongoing leak detection surveys (recommended 6-monthly) justify purchasing an ultrasonic detector, which pays back in the first survey through identified leak savings.
Using Audit Results to Access State Energy Efficiency Incentives
A properly documented compressed air energy audit is the foundation for accessing state government energy efficiency incentive programmes. The Victorian Energy Upgrades (VEU) programme, NSW Energy Savings Scheme (ESS), and Queensland Energy Savers programme all have pathways for compressor-related upgrades, and all require measured baseline energy data and calculated savings to support incentive claims.
For the NSW ESS specifically, variable speed drive installations on compressor motors are eligible under the Motor Energy Saver activity (MEPS). The incentive is calculated based on measured energy savings over a baseline period, expressed as Energy Savings Certificates (ESCs) valued at AUD $30–60 each. A correctly documented audit provides the baseline data required to calculate and register ESC claims.
Audit Data Requirements for State Incentive Programmes
- → Minimum 30-day pre-upgrade energy consumption data (some programmes require 12 months)
- → Compressor model, nameplate data, and age at time of audit
- → Operating hours per day and production schedule documentation
- → Specific power at baseline load points (measured, not estimated)
- → Post-upgrade verification data over equivalent period
Recommended Post-Audit Upgrade
When the audit identifies that the existing compressor is underperforming or incorrectly sized
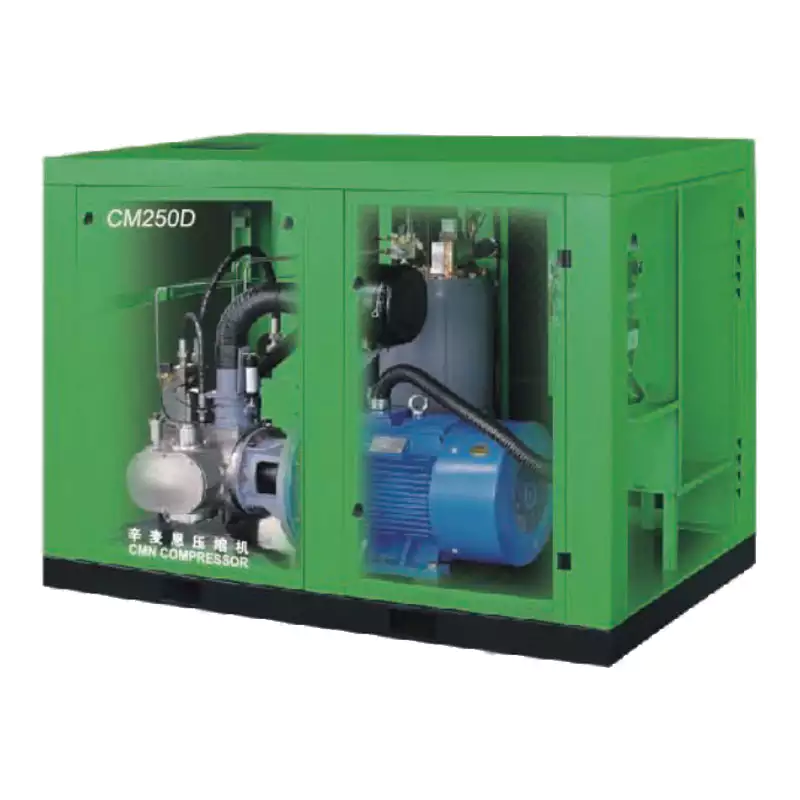
CM45D Water-Lubricated Oil-Free Screw Compressor with VSD
When a compressed air energy audit identifies that the existing compressor is operating with poor part-load efficiency, oversized for current demand, or running a fixed-speed motor that wastes energy in unloaded operation, the CM45D represents the most energy-efficient replacement option in the 37–45 kW class. The permanent magnet VSD motor achieves rated efficiency down to 25% of full load — matching energy consumption precisely to the demand profile identified in the audit. The water-lubricated compression element runs cooler than dry-screw alternatives, maintaining efficiency across the service life without the efficiency degradation that occurs as oil-injected rotors wear. Post-installation energy submetering verification will demonstrate the audit-projected savings in the first month of operation.
View CM45D Specifications →
Frequently Asked Questions
How long does a compressed air energy audit take?
A comprehensive audit of a single-compressor facility typically requires 5–10 working days from first instrument installation to completed report. The energy baseline logging requires a minimum of 5 days of continuous measurement. The leak survey can be completed in 4–8 hours for a medium-sized facility. The pressure profile survey takes 2–4 hours. Data analysis and report writing takes 1–2 days. The timeline is driven primarily by the logging period — if you need faster results, some state energy programmes allow the use of historical energy billing data as a partial substitute for logged data in the baseline calculation.
Can I conduct the audit myself or do I need an external specialist?
A facility engineer with compressed air system knowledge can conduct most elements of a compressed air energy audit using hired instruments and the methodology described in this guide. The pressure profile survey, heat recovery assessment, and inappropriate use identification are all straightforward. The leak survey requires some training on the ultrasonic detector — most equipment hire companies provide basic training, and manufacturer training videos are available online. The energy baseline measurement requires a data logger and basic data analysis. For formal ESS or VEU incentive claims, some programmes require the audit to be conducted by an accredited assessor. For internal decision-making and ESG reporting purposes, a self-conducted audit with measured data is entirely credible.
What is the typical payback period on leak repair programmes?
Leak repair payback periods are among the shortest of any energy efficiency investment. A systematic leak detection survey using ultrasonic equipment typically costs AUD $1,500–4,000 (including equipment hire or external specialist time). The repairs themselves are usually straightforward — tightening fittings, replacing thread sealant, changing quick-connect fittings — with total repair costs of AUD $500–3,000 for a typical medium-sized facility. Against a typical finding of 15–25% leak rate in an existing system, the annual saving for a 37 kW system is commonly AUD $3,000–8,000 per year. Payback periods of 3–6 months are typical. The leak survey should be repeated every 6–12 months because leaks reappear as fittings age and vibration continues.
My compressor is relatively new. Is an energy audit still worthwhile?
Yes — the energy audit value for a new system is in the demand-side and pressure profile analysis, not in supply-side efficiency assessment. A new compressor may be operating at its rated efficiency but still consuming excess energy because: the system setpoint is higher than the highest-demand use point requires; leaks have already developed in the distribution system (even new systems can have installation leaks); or inappropriate use applications are consuming significant flow that could be eliminated. The leak survey is particularly valuable in the first year after commissioning — construction debris, fitting disturbance, and thread sealant failures often create a significant leak population that emerges within 6–12 months of installation.
How do I calculate the CO₂e reduction from identified improvements for sustainability reporting?
Convert the identified energy saving to CO₂e using your state’s grid emissions factor from the NGERS Technical Guidelines (published annually by the Clean Energy Regulator). Multiply the annual kWh saving by the state grid emissions factor (kg CO₂e/kWh) to get the annual Scope 2 CO₂e reduction. For example, a 15% energy saving on a 55 kW compressor running 5,000 hours/year in Queensland (0.73 kg CO₂e/kWh): Annual saving = 55 × 5,000 × 0.15 × 0.73 = 30,113 kg CO₂e = 30 tonnes CO₂e/year. This figure is suitable for inclusion in GRI 302 and GRI 305 disclosures and in customer sustainability questionnaire responses, provided it is based on measured rather than estimated baseline data.
Start Your Compressed Air Energy Audit Today
Australia Oil Free Air Compressor Co., Ltd. can assist with compressed air energy audit scope definition, instrument recommendations, and post-audit system upgrade specification. Based in the Charlton Industrial Area, serving manufacturers across Australia.