Pressure Drop Diagnosis Guide

Pressure drop in a compressed air system is one of the most costly and most commonly underestimated problems in industrial compressed air. Every bar of pressure drop that the oil-free air compressor must compensate for costs approximately 7% additional energy. This guide identifies every source of pressure drop — from the compressor itself to the last fitting before the tool — with practical measurement methods and solutions for each.

✦ 7 Pressure Drop Sources
✦ Measurement Methodology
✦ Maximum Allowable Limits
Oil-free air compressor pressure drop diagnosis

Understanding Pressure Drop: Why Every Bar Matters

Pressure drop is the reduction in air compressor PSI between the point of generation (compressor outlet) and the point of use (tool connection). It is caused by friction losses in pipework, pressure drop across treatment equipment (filters, dryers), resistance at fittings and valves, and velocity-related losses in undersized pipe sections. Unlike an air leak — which is visible (or audible) — pressure drop is invisible, which is why it is frequently left unaddressed even as it accumulates over years of system modifications and equipment additions.

The energy penalty of pressure drop is significant. A well-established rule of thumb in compressed air engineering is that each 1 bar of additional discharge pressure requires approximately 7% additional compressor energy. When a system has 1.5 bar of accumulated pressure drop between the compressor and the tools, the compressor must be set to 1.5 bar above the actual tool requirement — consuming 10–11% more energy than a system with negligible pressure drop. For a 37 kW compressor operating 4,000 hours per year at AUD $0.25/kWh, this represents approximately AUD $1,500–2,000 of unnecessary energy cost per year from pressure drop alone.

The industry standard maximum allowable pressure drop from compressor outlet to point of use is 0.5 bar total for well-designed systems. Many industrial systems in Australia have accumulated 1.0–2.0 bar of total pressure drop through years of incremental modifications, undersized additions, and neglected filter maintenance.

How to Measure Pressure Drop Systematically

Systematic pressure drop measurement requires calibrated gauges or pressure transducers at multiple points in the system, measured simultaneously during a representative production period. The principle is simple: record pressure at the inlet and outlet of each component or pipe section; the difference is the pressure drop across that section.

Measurement Points for Complete Pressure Drop Survey
Compressor
Outlet
P₁
After
Aftercooler
P₂
Receiver
Outlet
P₃
After
Dryer
P₄
After
Filters
P₅
Main
Header
P₆
Branch
Outlet
P₇
Point
of Use
P₈

Record all pressures simultaneously during a representative production period at 70–80% of typical demand. Subtract each reading from the previous to get pressure drop across each section.

Maximum Allowable Pressure Drop by Component
Component / Section Maximum Allowable ΔP Action if Exceeded
Aftercooler and moisture separator 0.05–0.1 bar Clean aftercooler fins; check separator internals
Refrigerated dryer 0.1–0.2 bar Service dryer; check heat exchanger fouling; verify refrigerant charge
Coalescing filter (new element) 0.05–0.1 bar Replace element if ΔP exceeds 0.2 bar (end-of-service indicator)
Particulate filter (new element) 0.05–0.08 bar Replace element; check for incorrect element grade specified
Carbon adsorber (new media) 0.05–0.1 bar Replace carbon media; check for media compaction (channelling)
Main distribution header (well-sized) 0.05–0.1 bar If exceeded: upsize pipework or convert to ring main layout
Branch piping to point of use 0.1 bar Check pipe bore, length, and number of fittings; upsize or reroute

The 7 Causes of Pressure Drop: Diagnosis and Fix

1 — Undersized Distribution Pipework
Most common permanent pressure drop cause

Pipe friction pressure drop follows the Darcy-Weisbach equation — it increases with the square of flow velocity and inversely with pipe diameter to the 5th power. This means a small increase in pipe diameter dramatically reduces pressure drop, while adding extra length or fittings to an already undersized pipe dramatically increases it. The most common source of undersized pipework is incremental system expansion — branch connections added without reassessing the main header capacity.

Typical maximum design velocities: 6–8 m/s in main headers; 8–12 m/s in branch lines; 15–20 m/s in flexible hose connections (short runs only). Velocities above these limits produce significant friction pressure drop.

Quick pipe bore sizing guide (7 bar system):

Flow (L/s) Min bore (mm)
≤ 2 20 mm
2–5 32 mm
5–10 40–50 mm
10–25 65–80 mm

Fix: Upsize pipework or convert dead-end system to ring main (bisects effective pipe length).

2 — Compressed Air Leaks

Compressed air leaks cause two distinct types of pressure problem: they increase the compressor’s demand (causing longer run times and higher duty cycle), and in systems without adequate receiver volume, they cause persistent pressure sag during production because the compressor cannot meet the combined demand of tools plus leakage. A compressed air system with 20% leakage may show adequate pressure during off-shift periods but persistent pressure deficit during production — because the compressor was sized for production demand, not production plus leakage.

Common leak locations: threaded fittings, hose connections, quick-connect couplings, drain valves, cylinder rod seals, filter bowl o-rings, and isolation valve packing.

Leak detection and quantification:

→ Ultrasonic leak detector: most effective; detects leaks through noise rather than soap bubbles; works at all pressure levels; can detect leaks in inaccessible locations

→ Soapy water spray: low-cost; effective on accessible fittings; cannot detect vapour-phase leaks

→ Pressure decay test: isolate system, record pressure drop over time at no demand — quantifies total leakage rate without locating individual leaks

→ Repair priority: largest leaks first. A single ½” ball valve gland leak can exceed the total demand of multiple small tools.

3 — Blocked or Loaded Filter Elements

Compressed air filter elements accumulate particulate and coalesced liquid over their service life. Filter element pressure drop increases from the initial clean-element value (typically 0.05–0.1 bar) to the end-of-service indicator value (typically 0.2 bar per element). A complete filter train with three elements — particulate, coalescing, and carbon adsorber — that has each element at end of service contributes 0.6 bar of pressure drop from filters alone.

In systems where all elements are overdue for replacement, the compressor is effectively set 0.5–0.8 bar higher than it needs to be — compensating for filter pressure drop rather than delivering useful pressure to the tools.

Filter maintenance action plan:

→ Install differential pressure gauges or indicators across each filter housing — visual indication of service requirement

→ Replace elements when ΔP indicator reaches end-of-service mark, or at the time interval specified by the manufacturer (whichever comes first)

→ Never operate filters without elements — a filter housing in bypass provides no filtration and no pressure drop

→ Track element replacement dates and ΔP readings as a trend — shortening service intervals indicate increasing contamination load

4 — Compressed Air Dryer Pressure Drop

Refrigerated dryers contribute 0.1–0.2 bar of pressure drop in normal operation from the heat exchanger passages. This increases when: the heat exchanger is fouled (refrigerant side fouled by oil — common after a filter element failure upstream; air side fouled by scale or debris); the dryer is overloaded (actual flow exceeds rated capacity, increasing velocity through the heat exchanger); or the refrigerant charge is depleted (increasing heat exchanger ice-over, which progressively blocks airflow).

Desiccant dryers contribute very low pressure drop (typically 0.05–0.1 bar) when beds are correctly sized, but pressure drop increases dramatically if the desiccant beds are compacted (channelling), if the bed is operating in a saturated condition (failing to regenerate), or if the inlet particulate filter upstream is overloaded and shedding particles into the desiccant.

Dryer pressure drop diagnosis:

→ Measure ΔP across the dryer at rated flow — compare to manufacturer’s specification at commissioning

→ For refrigerated dryers: check refrigerant charge; inspect heat exchanger for ice-over during operation; verify rated flow is not being exceeded

→ For desiccant dryers: check regeneration cycle is operating (outlet dew point should cycle between values — steady warm dew point indicates failed regeneration)

→ Clean refrigerant-side heat exchanger with CO₂ blasting or chemical descale if oil-fouled

5 — Excess Fittings, Valves, and Direction Changes

Every fitting, valve, direction change, and pipe size transition in the distribution system adds resistance — expressed as an equivalent pipe length. A gate valve fully open adds the equivalent of 0.3–0.5 pipe diameters of straight pipe. A 90° standard elbow adds 25–40 pipe diameters. A ball valve fully open adds 3–5 diameters. In complex distribution systems with many bends, tees, and valves, the total equivalent pipe length may be twice or three times the actual straight pipe length — and the friction pressure drop is proportional to equivalent length.

Partially closed isolation valves — left partially throttled after commissioning or during maintenance and not fully reopened — are a frequent hidden source of unexpected pressure drop. Any valve in the compressed air system that is not a regulator should be either fully open or fully closed.

Fitting optimisation:

→ Replace standard 90° elbows with long-radius bends (reducing ΔP by 30–50% per bend)

→ Use full-bore ball valves rather than globe valves for isolation duties

→ Verify all isolation valves are fully open during normal operation — partially throttled valves add significant ΔP

→ Review system layout for opportunities to eliminate unnecessary direction changes and reduce run length

6 — Quick-Connect Couplings and Hose Fittings

Quick-connect couplings are a significant and frequently overlooked source of point-of-use pressure drop. A standard industrial quick-connect coupling (e.g., 1/4″ BSP type) has an internal bore of 4–6mm — far smaller than even the connecting hose. At flows typical of a pneumatic grinder or impact wrench (200–400 L/min free air), the pressure drop across a single quick-connect coupling can be 0.5–1.5 bar — comparable to the entire allowable budget for the whole distribution system.

Similarly, flexible hoses at point of use — particularly 6mm bore air hoses connecting to 1/4″ BSP tools — create velocity-related pressure drop at high flow. A 10-metre length of 6mm bore hose carrying 200 L/min loses 0.8–1.2 bar over its length.

Coupling and hose optimisation:

→ Use larger bore quick-connect couplings for high-flow tools — move from 1/4″ to 3/8″ or 1/2″ BSP coupling type

→ Specify minimum hose bore appropriate to tool demand — a 1″ bore hose for a large grinder vs a 6mm hose for a small blow gun

→ Minimise hose length at point of use — use a connection point close to the tool rather than a long trailing hose

→ Consider a local mini-receiver at high-demand fixed tools to eliminate hose pressure drop entirely

7 — Compressor Pressure Setpoint Set Too Low

Sometimes what appears as a pressure drop problem is actually a compressor setpoint that was never updated after the system was changed. If additional pressure-consuming equipment was added — additional tools, a higher-pressure process, or a longer distribution run — without correspondingly increasing the compressor setpoint, the system will appear to have excessive pressure drop because the compressor is not generating enough pressure to overcome the system’s resistance plus supply the tool pressure requirement.

Similarly, on variable speed drive compressors, the pressure setpoint may have been correctly configured at commissioning but drifted due to a controller firmware update or parameter reset after a power event.

Setpoint review:

→ Record the highest tool pressure requirement in the system

→ Add the total system pressure drop from the measurement survey

→ Set the compressor cutout pressure to: highest tool pressure + total ΔP + 0.5 bar safety margin

→ Check VSD controller setpoint against the maintenance record of the original commissioning setting

→ Note: increasing setpoint increases energy consumption by ~7% per bar — reducing system pressure drop first is more energy-efficient than raising setpoint

Compressed air pressure drop solution oil-free system

Pressure Drop Reduction: Priority Sequence for Maximum ROI

When reducing pressure drop in an existing system, address causes in the following sequence to achieve the greatest improvement per dollar spent:

1
Compressed air leak repair (free–low cost, immediate return). Fixing leaks reduces compressor load, reduces duty cycle, and restores pressure. A leak audit and repair programme typically delivers 10–20% reduction in energy costs — the highest ROI of any compressed air project.
2
Filter element replacement (low cost, immediate return). Overdue filter elements contribute 0.3–0.6 bar of avoidable pressure drop. Replacing a full filter train costs AUD $200–600 in elements and immediately reduces the compressor pressure setpoint by the same amount — reducing energy consumption proportionally.
3
Quick-connect coupling upgrade (low-medium cost, significant point-of-use improvement). Replacing undersized quick-connect couplings at high-demand tool connections delivers immediate pressure improvement at those tools. Cost: AUD $30–80 per connection. Benefit: 0.5–1.0 bar improvement at the tool.
4
Dryer service and optimisation (medium cost, significant ΔP reduction if fouled). A refrigerated dryer with fouled heat exchanger may be contributing 0.3–0.5 bar of avoidable pressure drop. Cleaning or servicing the dryer restores rated ΔP and may allow the compressor setpoint to be reduced by that amount.
5
Pipework upsizing or ring main conversion (higher cost, long-term solution). For systems where undersized main pipework is the primary pressure drop cause, upsizing the header or converting from a dead-end to a ring main distribution layout delivers permanent improvement. This is a capital project — typically justified by the energy saving from reduced compressor setpoint and the reliability improvement from lower velocity distribution.

Pressure Drop Assessment from Australia Oil Free Air Compressor

Australia Oil Free Air Compressor Co., Ltd. provides compressed air system pressure drop assessments as part of our system optimisation service. Our team measures pressure at all critical points in your system during a representative production period, identifies the largest contributors to system pressure drop, and provides a prioritised action plan with estimated energy savings for each recommendation.

For facilities where significant pressure drop has accumulated over years of system expansion, a pressure drop assessment typically identifies 0.5–1.5 bar of recoverable pressure drop — translating to 3–10% compressor energy reduction achievable through low-cost measures (leak repair, filter replacement, coupling upgrades) before any capital works are needed.

Contact us at [email protected] to arrange a pressure drop assessment at your facility.

Compressed air pressure drop assessment Australia
Recommended Product

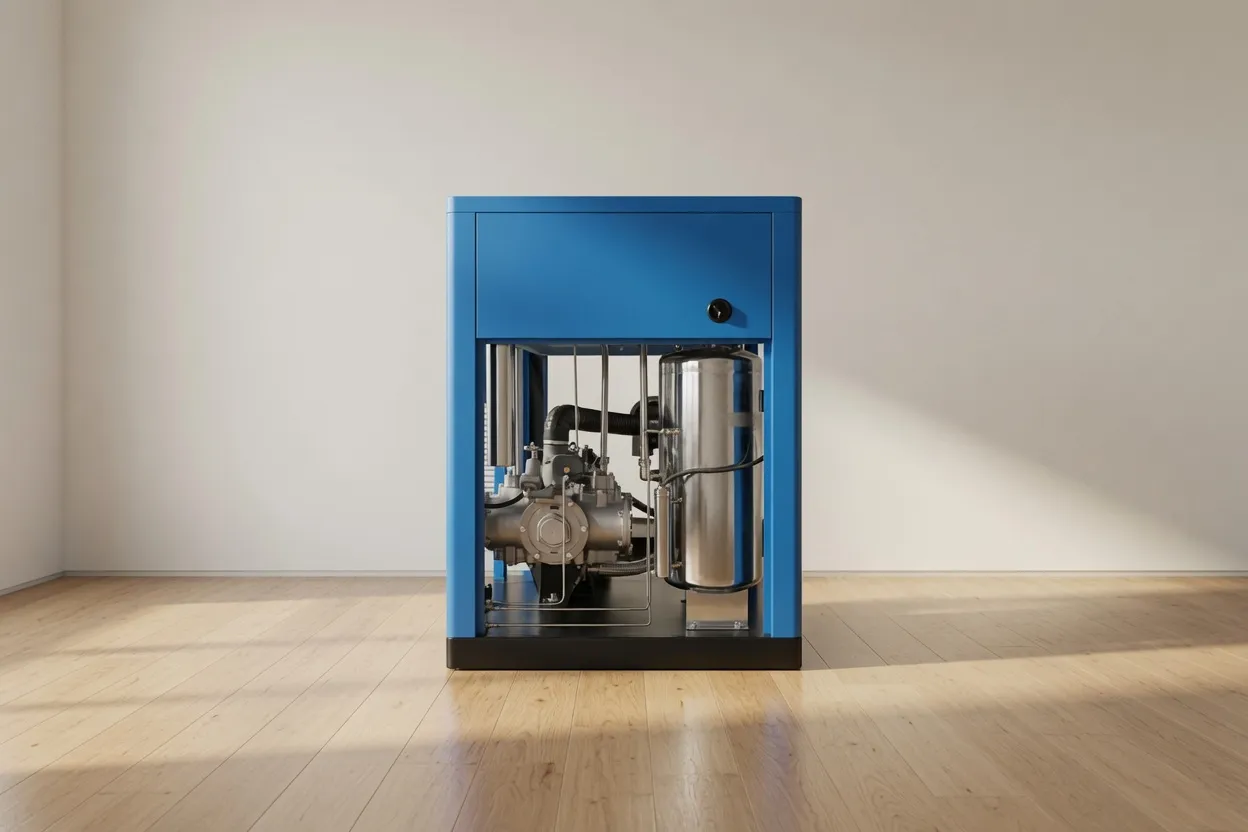
CM242GPV — Medium-Pressure Oil-Free Screw Compressor: Higher Setpoint, Same Energy

CM242GPV higher pressure oil-free compressor

For facilities where the root cause of pressure drop is fundamentally a capacity or pressure rating issue — where even after eliminating leaks, replacing filters, and optimising pipework, the compressor cannot supply adequate pressure at the tools — the CM242GPV medium-pressure oil-free screw compressor provides 16 bar rated discharge pressure. This additional pressure margin provides the compressor setpoint headroom to absorb reasonable system pressure drop while still delivering adequate pressure at the tool. The CM242GPV’s oil-free design maintains full quality compliance for all process-contact compressed air applications, and its variable pressure output (adjustable to application requirements) ensures no energy is wasted generating pressure above what is actually needed.

View CM242GPV Specifications

Frequently Asked Questions

What is acceptable total pressure drop from compressor to tool?+
The industry standard target for a well-designed compressed air system is a maximum total pressure drop of 0.5 bar from the compressor outlet to the point of use at full system flow. This includes all treatment equipment (aftercooler, dryer, filters) and all distribution pipework and fittings. Many older or modified systems have 1.0–2.0 bar of total drop — meaning the compressor is set 0.5–1.5 bar higher than necessary, consuming 3–10% more energy than a well-optimised system. Reducing total system pressure drop below 0.5 bar and then reducing the compressor setpoint accordingly is the single most energy-efficient improvement available in most existing compressed air systems.
Is a ring main always better than a dead-end distribution system?+
A ring main — where the distribution loop returns to the supply point, creating two parallel flow paths — effectively halves the flow in each section of pipe compared to a dead-end system of the same total length. This halves the velocity and reduces friction pressure drop by approximately 75% (following the square law of flow velocity versus pressure drop). For facilities with long distribution runs or uneven demand distribution along the pipe route, a ring main conversion is typically the most cost-effective pipework modification available. For very short distribution systems (under 30 metres total) or systems with a single dominant use point, the benefit of a ring main is marginal and may not justify the additional pipework cost.
How much does compressed air pressure drop cost in energy terms?+
Each additional bar of compressor discharge pressure requires approximately 7% additional energy input, all other things being equal. For a 37 kW compressor operating 4,000 hours per year at AUD $0.25/kWh, the annual energy cost is approximately AUD $37,000. Each 1 bar of avoidable system pressure drop that forces the compressor to run 1 bar higher than necessary costs approximately AUD $2,600 per year (7% of AUD $37,000). A system with 1.5 bar of avoidable pressure drop is therefore wasting approximately AUD $3,900 per year in energy. This calculation assumes AUD $0.25/kWh — for facilities with higher electricity tariffs, the saving is proportionally greater.
Should I upsize the compressor or fix the system pressure drop?+
Almost always fix the pressure drop first. Upsizing the compressor to compensate for system pressure drop is the most expensive and least efficient solution — a larger compressor running harder to overcome system resistance uses significantly more energy and still delivers a sub-optimal distribution system. Reducing system pressure drop is typically 5–20× more cost-effective than upsizing the compressor to compensate for the same deficit. The exception is when demand has genuinely grown beyond the existing compressor’s capacity regardless of system pressure drop — in which case the correct sequence is still to fix system pressure drop first, then assess whether the compressor capacity deficit remains after the pressure drop is eliminated.
How do I calculate the required pipe diameter for my compressed air system?+
The standard approach uses the Darcy-Weisbach equation simplified for compressed air: calculate the design flow in free air litres per second (sum all connected tool demands at their operating duty cycles); convert to compressed air volume flow at the system pressure; calculate pipe velocity = flow / pipe cross-section area; adjust pipe diameter until velocity is below 6–8 m/s for mains and 8–12 m/s for branches. For practical purposes, use the simplified sizing table provided in the measurement section of this article — it gives minimum bore for common flow ranges at 7 bar system pressure. For higher pressure systems (above 10 bar), the compressed air volume is smaller for the same free air flow, so pipes can be slightly smaller for the same free air delivery. Contact our team for a pipe sizing calculation for your specific system parameters.

Australia Oil Free Air Compressor Co., Ltd.

Charlton Industrial Area, Australia  |  [email protected]

Book a Pressure Drop Assessment